Note
Click here to download the full example code
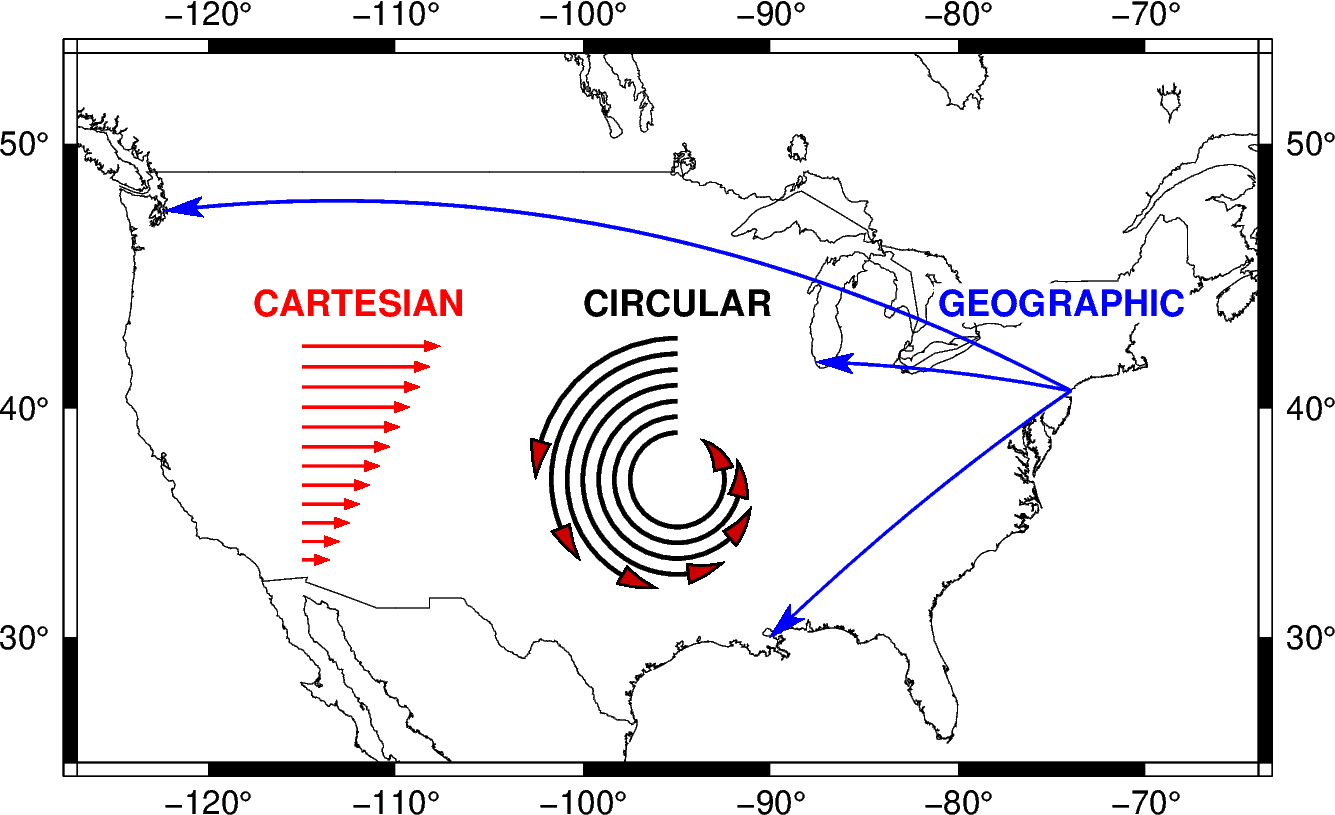
Cartesian, circular, and geographic vectors
The pygmt.Figure.plot method can plot Cartesian, circular, and geographic vectors.
The style parameter controls vector attributes.

Out:
<IPython.core.display.Image object>
import numpy as np
import pygmt

# Create a plot with 15x15 cm basemap, Mercator projection (M) over the continental US
region = [-127, -64, 24, 53]
fig = pygmt.Figure()
fig.coast(region=region, projection="M15c", frame="10.0", borders="1", area_thresh="4000", shorelines="0.25p,black")


# plot cartesian vectors with different lengths
x = np.linspace(-115, -115, 12)  # x vector coordinates
y = np.linspace(33.5, 42.5, 12)  # y vector coordinates
xvec = np.linspace(1, 5, 12)  # dx vector data
yvec = np.zeros(np.shape(y))  # dy vector data
style = "v0.2+e+a40+gred+h0+p1p,red+z0.35"
pen = "1.0p,red"
fig.plot(x=x, y=y, style=style, pen=pen, direction=[xvec, yvec])
fig.text(text="CARTESIAN", x=-112, y=44.2, font="13p,Helvetica-Bold,red", fill="white")


# plot math angle arcs with different radii
x = -95
y = 37
startdir = 90  # in degrees
stopdir = 180  # in degrees
radius = 1.8
pen = "1.5p,black"
arcstyles = np.repeat("m0.5c+ea", 7)
for arcstyle in arcstyles:
    data = np.array([[x, y, radius, startdir, stopdir]])
    fig.plot(data=data, style=arcstyle, color="red3", pen=pen)
    stopdir += 40  # set the stop direction of the next circular vector
    radius -= 0.2  # reduce radius of the next circular vector
fig.text(text="CIRCULAR", x=-95, y=44.2, font="13p,Helvetica-Bold,black", fill="white")


# plot geographic vectors using endpoints
NYC = [-74.0060, 40.7128]
CHI = [-87.6298, 41.8781]
SEA = [-122.3321, 47.6062]
NO = [-90.0715, 29.9511]
style = "=0.5+e+a30+gblue+h0.5+p1p,blue+s"  # = for geographic coordinates, +s for coord end points
pen = "1.0p,blue"
data = np.array([[NYC[0], NYC[1], CHI[0], CHI[1]]])
data = np.vstack((data, np.array([[NYC[0], NYC[1], SEA[0], SEA[1]]])))
data = np.vstack((data, np.array([[NYC[0], NYC[1], NO[0], NO[1]]])))
fig.plot(data=data, style=style, pen=pen)
fig.text(
    text="GEOGRAPHIC", x=-74.5, y=44.2, font="13p,Helvetica-Bold,blue", fill="white"
)
fig.show()
Total running time of the script: ( 0 minutes 2.656 seconds)